So you want to start a coffee cart?

Will it actually
make money?

Run your idea through real Australian data and three perspectives — the upsides, the pitfalls, and the numbers you'd actually live with. Before you spend a cent.

Type your idea in plain English. Understand what it can cost and what it can make. Every number explained.
or try:

Free to start.

Modelled output · Brunswick · illustrative example
A coffee cart, modelled
preview
Revenue in
$34,236
Spent
$23,422
You keep
$10,814
the 2am version → your idea, modelled.
Before you commit

Most ideas don't fail for lack of passion.
They fail for lack of cashflow.

The hard truth
52%
Don't reach year 3.
Just 48% of new Australian businesses are still trading three years on.
ABS · CABEE 2024–25
The main reason
43%
Name cashflow.
43% say cash flow is their single biggest concern — ahead of profitability and inflation.
NAB SME Survey · 2025
How widespread
~80%
Hit a cash crunch.
80% of Australian SMEs felt a cash-flow impact in the past 12 months.
CommBank–UNSW · 2025
And yet
437,150
Started anyway.
Australians still backed themselves and launched a business last year.
ABS · CABEE 2024–25

We're here to help you go in with your eyes open.

See what the model shows →
Sources: ABS Counts of Australian Businesses (CABEE) 2024–25 · NAB SME Business Survey 2025 · CommBank–AGSM @ UNSW SME cash-flow survey 2025. Indicative national figures, not advice.
…and it works for whatever you're dreaming up.
Three perspectives

You see the case for and against, not just the upside.

Every idea gets read three ways — the hopeful, the worried, and the balanced view that weighs them both. You see all three, then the clarity to make your own call.

The hopeful lens

What could go right

Reads the upside — the realistic opportunities, the demand, and where businesses like yours have done well.

The worried lens

What could go wrong

Looks for what could go wrong — the cost surprises, the slow months, the things founders gloss over.

The balanced lens

What it actually says

Weighs both and lays out where things land — the trade-offs, in plain English, so the call stays yours.

How it works

From a scribble on a napkin
to numbers you can check.

Three steps. You bring the idea — we bring the maths, the Australian data, and plain English.

1.

Tell us your idea

"a coffee cart
in Brunswick…"

Plain words. Seven short questions, each pre-filled from real market data.

2.

We do the maths

Costs, cash flow, staffing and revenue run through a real engine — checked against Fair Work, the ATO and live local rates. Agree or disagree with any number; override it with your own.

3.

Get the full picture

The upsides and the pitfalls, costs and cashflow, all in plain English — and all of it yours to change.
Your plan, the way you'll actually read it.

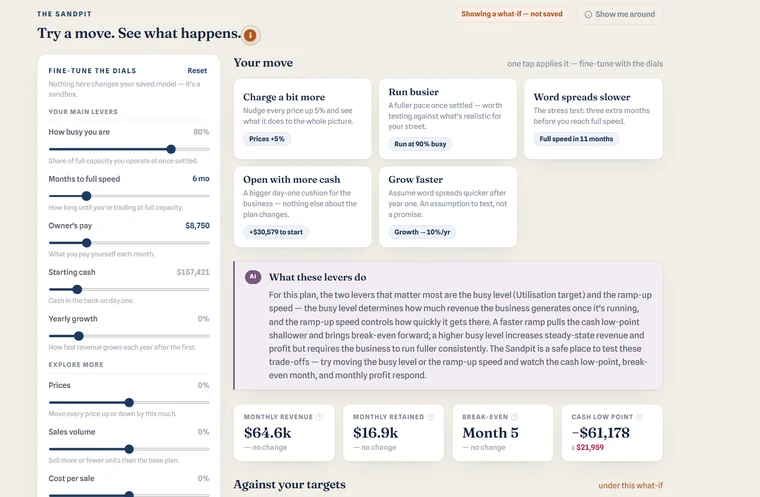
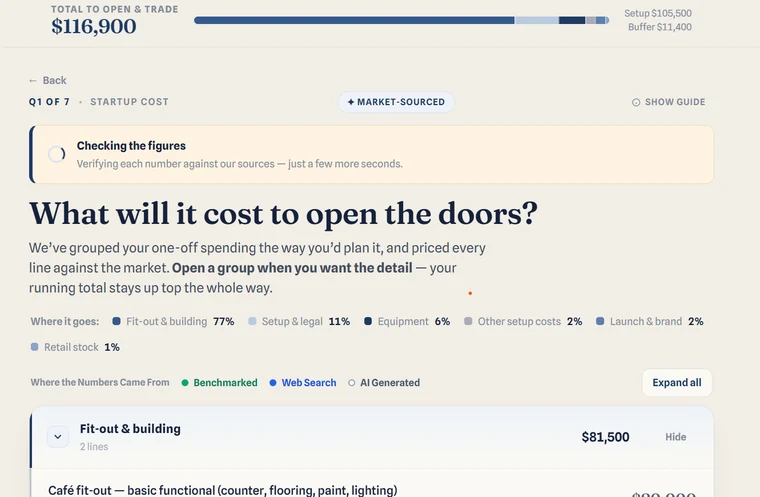
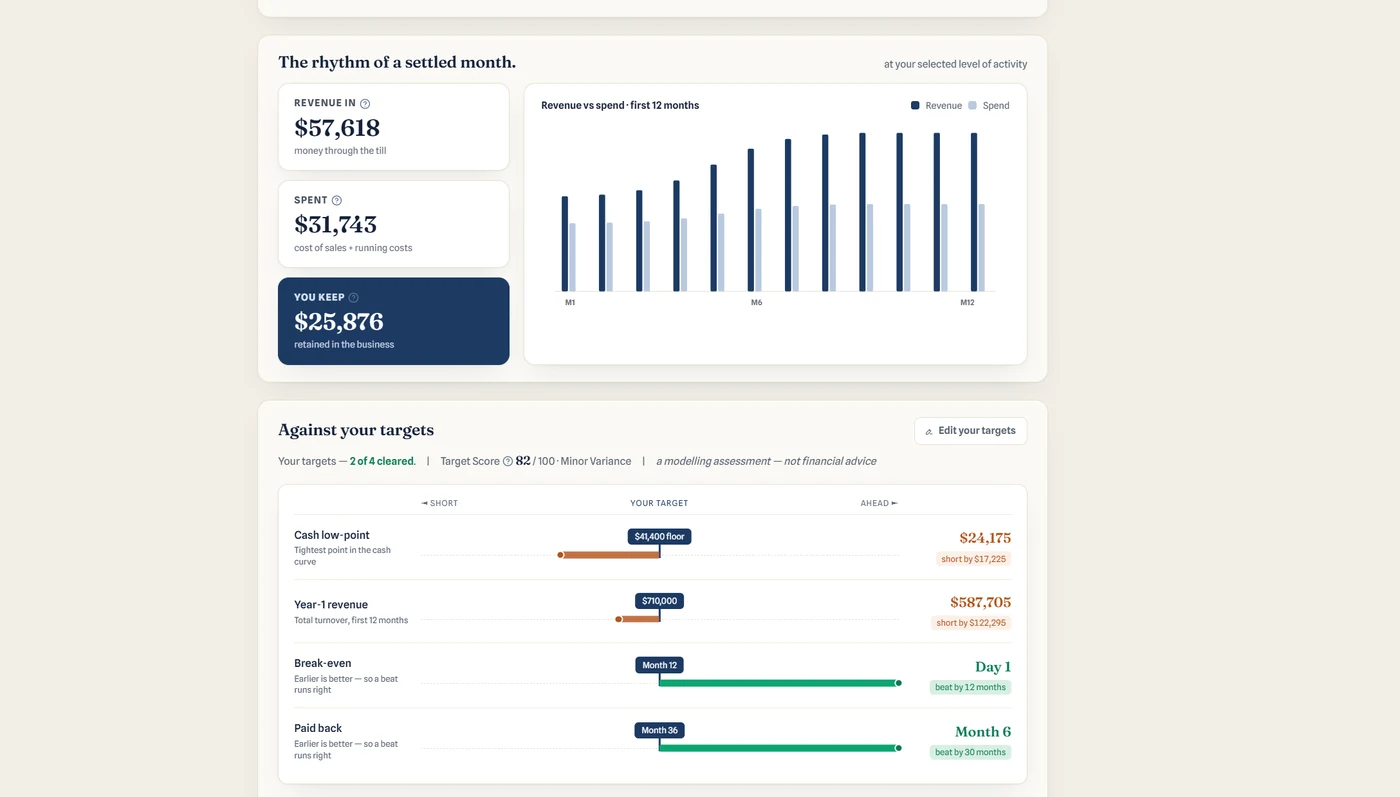
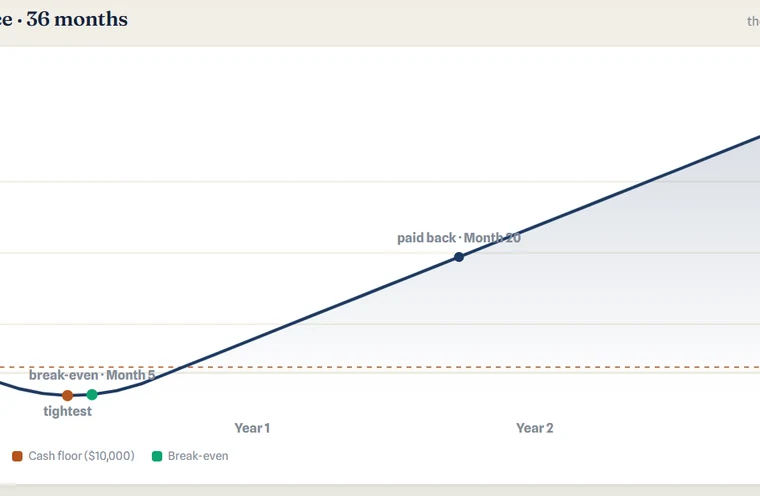
The report overview, the cash curve, the questions we ask, and the Sandpit.

BizModler report overview — the rhythm of a settled month (revenue in, spent, you keep) and how the model reads against the founder's targets
The cash curve — cash position over 36 months, with the tightest point, break-even and paid-back marked
The Sandpit — change a figure and watch the whole model recalculate
The intake questions — startup costs grouped the way you'd plan them, every line priced against the market

So… what do the numbers say?

There's only one way to find out. Ten minutes, no spreadsheet, no card.

See what the numbers say →
model your own idea in about ten minutes